


Vlad Yudkin
January 18, 2024
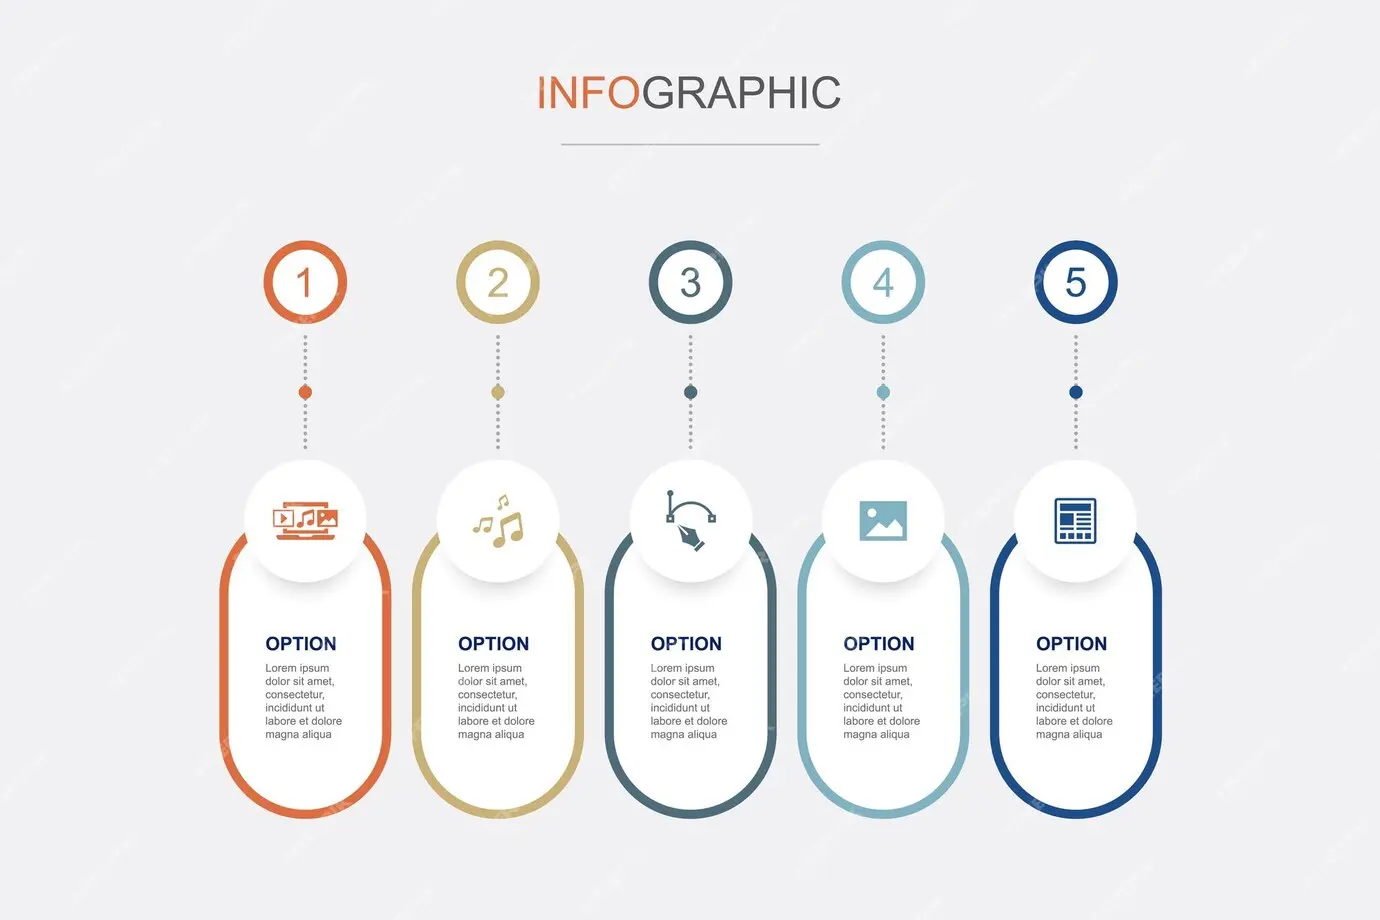
The Power of Infographic Design: Communicating Complex Ideas with Simplicity
Nowadays, information overload is a common challenge; therefore, the ability to convey complex ideas quickly and effectively has become paramount. Infographic design has emerged as a powerful tool to address this challenge. Together, let's find out what an infographic design is and delve into its versatile applications across various fields.
Understanding Infographic Design
An infographic is a visual representation of information, data, or knowledge designed to present complex information quickly and clearly. It combines text, images, and graphics to transform intricate concepts into easily digestible and visually appealing content. Infographics simplify information, making it accessible to a wider audience, regardless of their familiarity with the topic.
Elements of an Infographic
- Visual Elements. Icons, illustrations, and charts are used to represent data and ideas visually. Color schemes and typography are carefully chosen to enhance readability and aesthetics.
- Information. Infographics present concise and relevant information, focusing on key points and statistics to deliver a clear message.
- Structure. Infographics are organized into sections or blocks, guiding the viewers' eyes from one point to another. The flow of information is logical and intuitive.
Applications of Infographic Design
Educational Purposes
In educational settings, infographics simplify complex topics, making learning engaging and accessible. They are widely used in classrooms, textbooks, and online courses to aid students' understanding of various subjects.
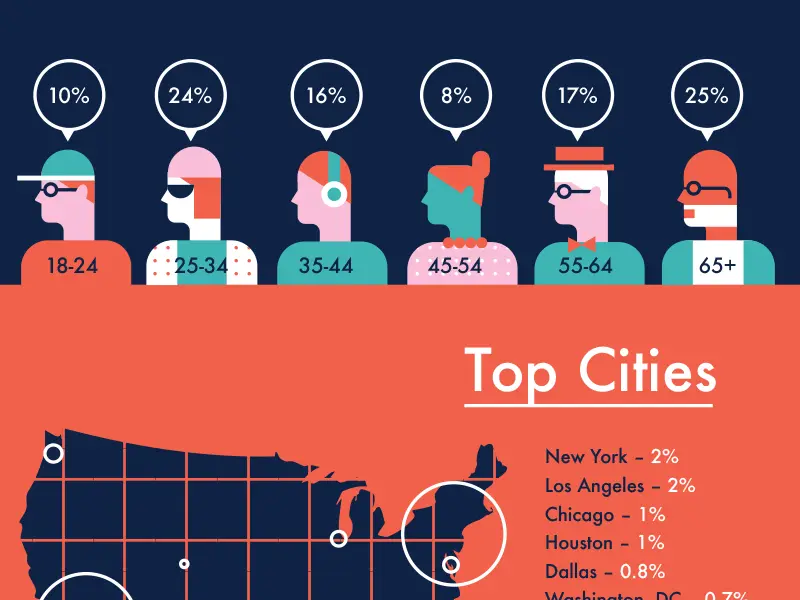 Image source
Data Visualization
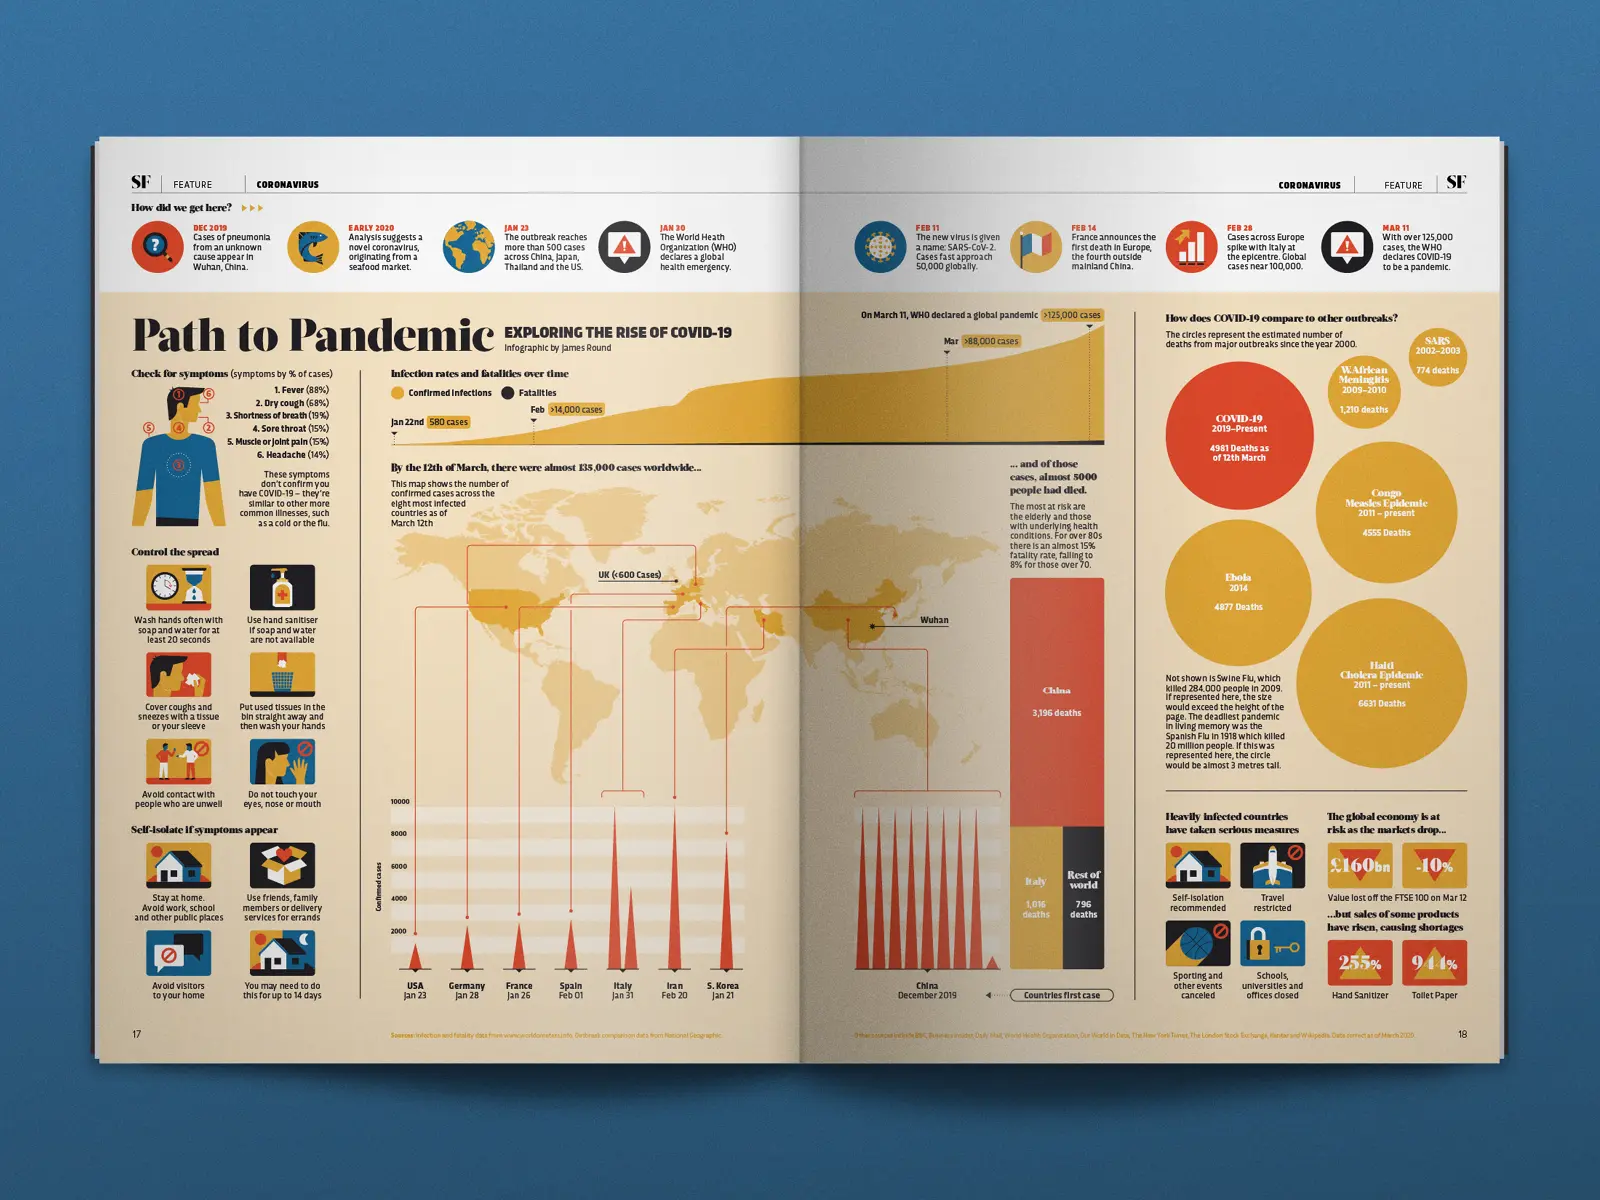
Infographics are invaluable for presenting statistical data and research findings. By transforming data into visually compelling charts and graphs, infographics allow researchers and analysts to communicate their insights effectively.
Marketing and Advertising
Businesses leverage infographics to showcase their products or services in a visually appealing manner. Infographics are shared on social media platforms and websites, attracting potential customers and driving engagement.
Content Marketing
In content marketing, infographics serve as shareable content that attracts backlinks, social media shares, and website traffic. They enhance brand visibility and authority by presenting valuable information in an easily shareable format.
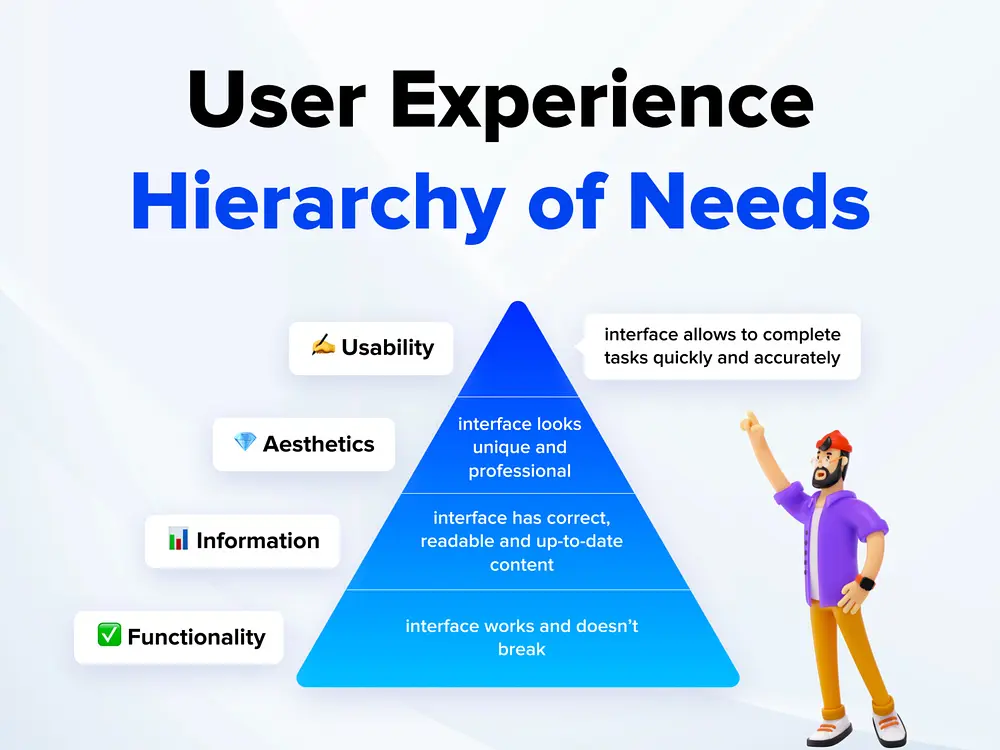 Image source
Healthcare and Public Awareness
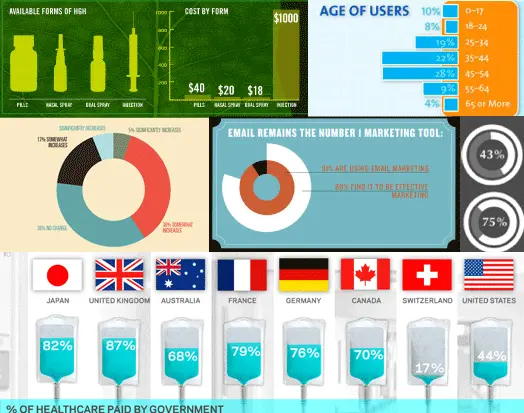
Healthcare professionals use infographics to educate patients about diseases, treatments, and preventive measures. Similarly, infographics are employed in public awareness campaigns to disseminate critical information on social issues, emergencies, and public health initiatives.
Corporate Communication
Within organizations, infographics simplify complex business strategies, processes, and data for employees and stakeholders. They are used in presentations, reports, and internal communications to enhance understanding and engagement.
Crafting Impactful Infographics: 10 Essential Tips for Effective Design
- Informational Honesty. Ensure accuracy and credibility in the information you present. Verify your data sources and cross-check statistics. Misleading or inaccurate information can harm your credibility and trustworthiness.
- Minimalism. Embrace simplicity in your design. Avoid clutter and focus on essential information. Use clean lines, limited color palettes, and concise text to maintain a minimalist aesthetic. Minimalistic infographics are visually appealing and easier for viewers to absorb.
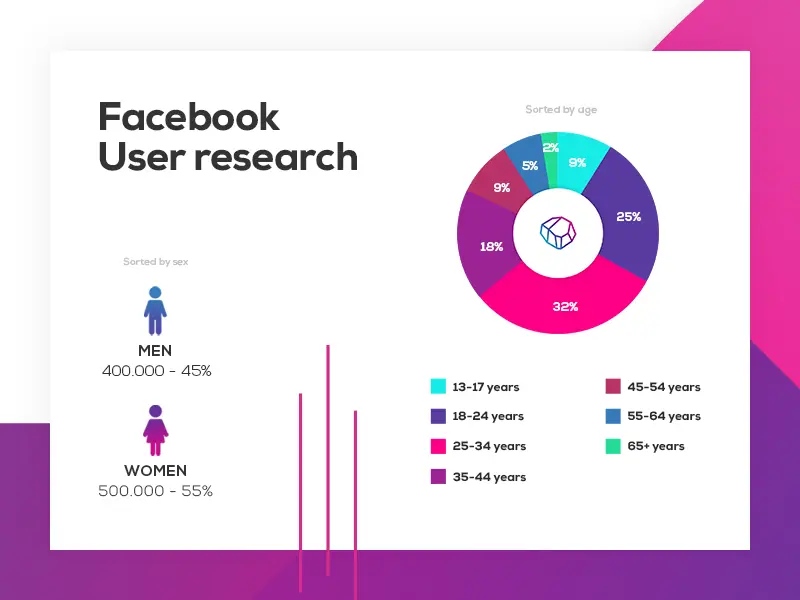 Image source
- Choose Readable Fonts. Select clear, legible fonts for your infographic. Avoid overly decorative or complex fonts that might hinder readability. Sans-serif fonts like Arial, Helvetica, or Roboto are often preferred for their simplicity and readability, especially in digital formats.
- Present Simple Illustrations. Use straightforward illustrations to represent ideas. Complicated visuals can confuse the audience. Icons and symbols should be universally recognizable, ensuring that viewers from diverse backgrounds can understand the message without ambiguity.
- Interactivity. If the platform allows, consider adding interactive elements to your infographic. Interactive infographics engage users by allowing them to explore the content actively. This could include clickable elements, animations, or hover-over effects that reveal additional information. Interactive infographics enhance user experience and make the content more memorable.
- Tell a Story. Infographics are most effective when they convey a narrative. Organize your information in a logical sequence, guiding the viewer from one point to the next. Start with a compelling title, introduce the problem or topic, present supporting data, and conclude with a clear takeaway or call to action. A well-structured story keeps the audience engaged and ensures better retention of information.
- Color Psychology. Use colors strategically to evoke specific emotions or convey particular messages. Different colors can influence how people perceive the information. For example, blue is often associated with trust and reliability, while red can signify urgency or importance.
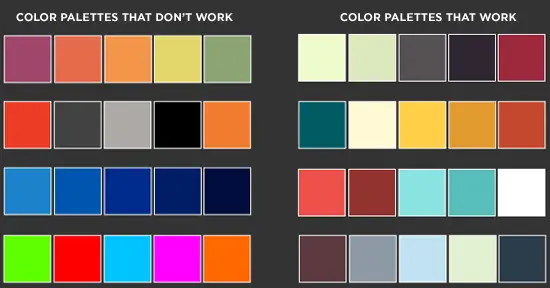
- Consistent Visual Style. Maintain a consistent visual style throughout the infographic. Consistency in colors, fonts, and icons creates a cohesive look, enhancing the overall professional appeal of your design.
- Mobile-Friendly Design. Ensure your infographic is responsive and mobile-friendly. Many users access content on smartphones and tablets, so your infographic should be easily viewable and navigable on various screen sizes.
- Feedback and Revisions. Seek feedback from peers or target audience members. Be open to revisions and constructive criticism. Iterative improvements based on feedback can significantly enhance the effectiveness of your infographic design.
14 Infographic Do's and Don'ts to Design Beautiful and Effective Infographics
By following these tips and adhering to the principles of informational honesty, minimalism, readable fonts, simple illustrations, interactivity, and storytelling, you can create engaging and impactful infographics that effectively convey your message to the audience.
 Image source
Conclusion
In a world inundated with information, infographic design stands out as a potent means of communication. By distilling intricate ideas into visually appealing and easily comprehensible graphics, infographics serve as a bridge between complexity and clarity. Whether in education, marketing, research, or public awareness, infographics continue to play a pivotal role in shaping the way we perceive and understand the world around us. As we move forward, the art of infographic design will undoubtedly remain a cornerstone in effective communication strategies.
Sources:
Design A Stunning Infographic With These 9 Tips And Tricks
Designing Effective Infographics
Infographic Design Trends 2021: Opposites Attract
The Do’s And Don’ts Of Infographic Design